How to display a queueing network model using the PMIF 2.0 modeling language and the weasel webservice
We would like to talk about a new feature implemented in the Linux version of the web service "Weasel",
that Is the ability to generate an image depicting the "PMIF 2.0" queueing network model.
We have extended the class implementing the web service with a new method named "ToImage".
The new method have the following syntax:
- ToImage_(model,model_type,output_format,option=NULL)
- model: is a string containing the model. At this time only PMIF 2.0 models are supported.
- model_type: is a string containing the model type. At this stime can be only: "PMIF 2.0".
- output_format: can be one of : "GIF", "PNG", "JPG", "SVG"
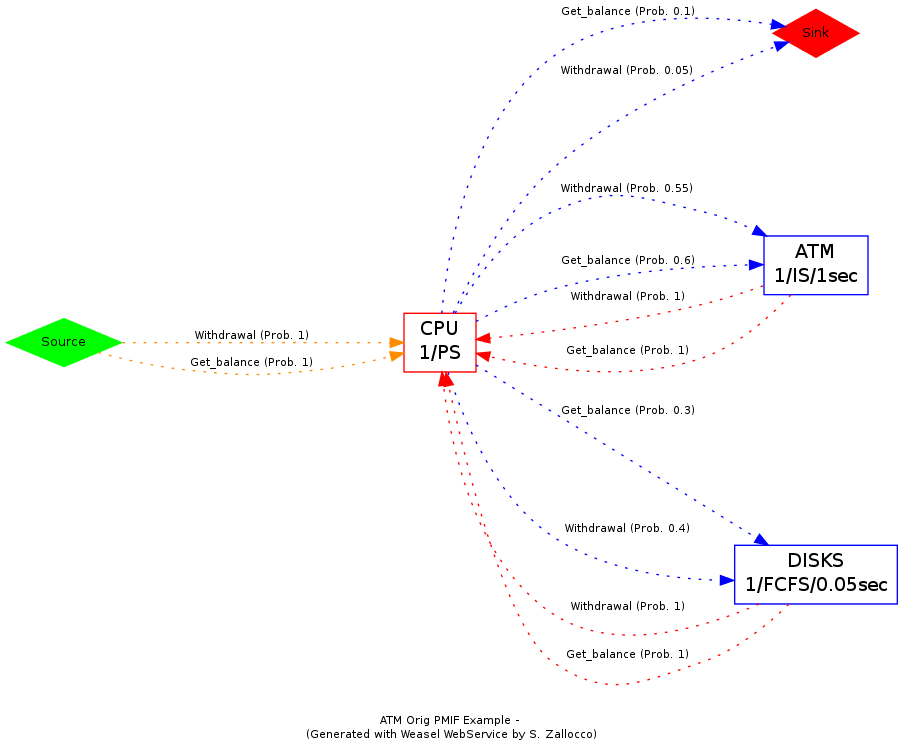
- option: is a string used to pass extended options to the method. At this time, the only supported extended options are: "workload:true", "workload:false". If the workload parameter is set to "true" then you will see the network of queues with workload instead of arcs .
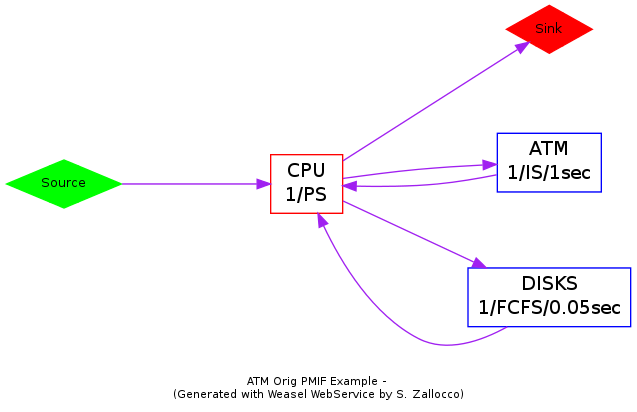
In the following images we show some output example. The first one show the PNG output without extended options set:

In the second one we set workload extended parameter to true to obtain the graph of workloads path:

Thats all! if you want to try it yourself follow this link and enjoy the magic.

